Work — 7 roles, newest first
Twelve years on the front end of data.
I started on ocean-research data in France and moved to Vancouver in 2015. Since then nearly every role has been the same problem in a new domain: a lot of data, and people who need to understand it quickly.
PolicyReporter
Present
Full-stack engineer
Vancouver, BC (remote)
policyreporter.com ↗- React
- PHP
- Amazon Quick Suite
- Component library
Leading the front end of a healthcare coverage-policy platform.
PolicyReporter tracks healthcare coverage policy: a great deal of structured data, and people who need the right part of it fast. I co-lead the front end’s technical direction: we set the code standards and decide the stack, which libraries we adopt, keep or retire.
- Created from scratch, and maintain, the component library 30 engineers build with. No bug reported against it, and feedback addressed as it comes in.
- Re-implementing legacy PHP pages in modern React.
- Dashboards with Amazon Quick Suite, through custom integration code because its SDK was too recent for our PHP version, with automatic user provisioning.
CS Disco
Jan 2022 – Aug 2024
Software architect, reporting
Austin, Texas (remote)
csdisco.com ↗- TypeScript
- React
- GraphQL
- react-window
- react-aria
A reporting product for legal teams, built from the ground up.
DISCO uses AI, cloud computing and data analytics to change how law is practised. A friend already worked there, and the mission made the decision easy. I joined to build Organization Metrics, a reporting product that shows customers how their whole organisation uses the platform, and I built it from the ground up: the architecture, the library choices and most of the code, with one back-end engineer alongside.
Starting from scratch meant I could use what I thought was right: TypeScript, React with hooks, GraphQL for data, and virtualization so the tables stay quick however much data comes back. The hard part was never the features. It was keeping a page that can show a year of activity across a large firm feel instant.
- Two views, data usage and events, with interactive tables, advanced filtering and sorting, search with highlighted results, and export to CSV and DOC.
- A new video player on the HTML5 video element, driven by a small imperative API so it could evolve without breaking changes.
- Contributions to the in-house UI library built on react-aria, and older pages moved from class components to hooks, with slow screens made fast through virtualization and better data fetching.
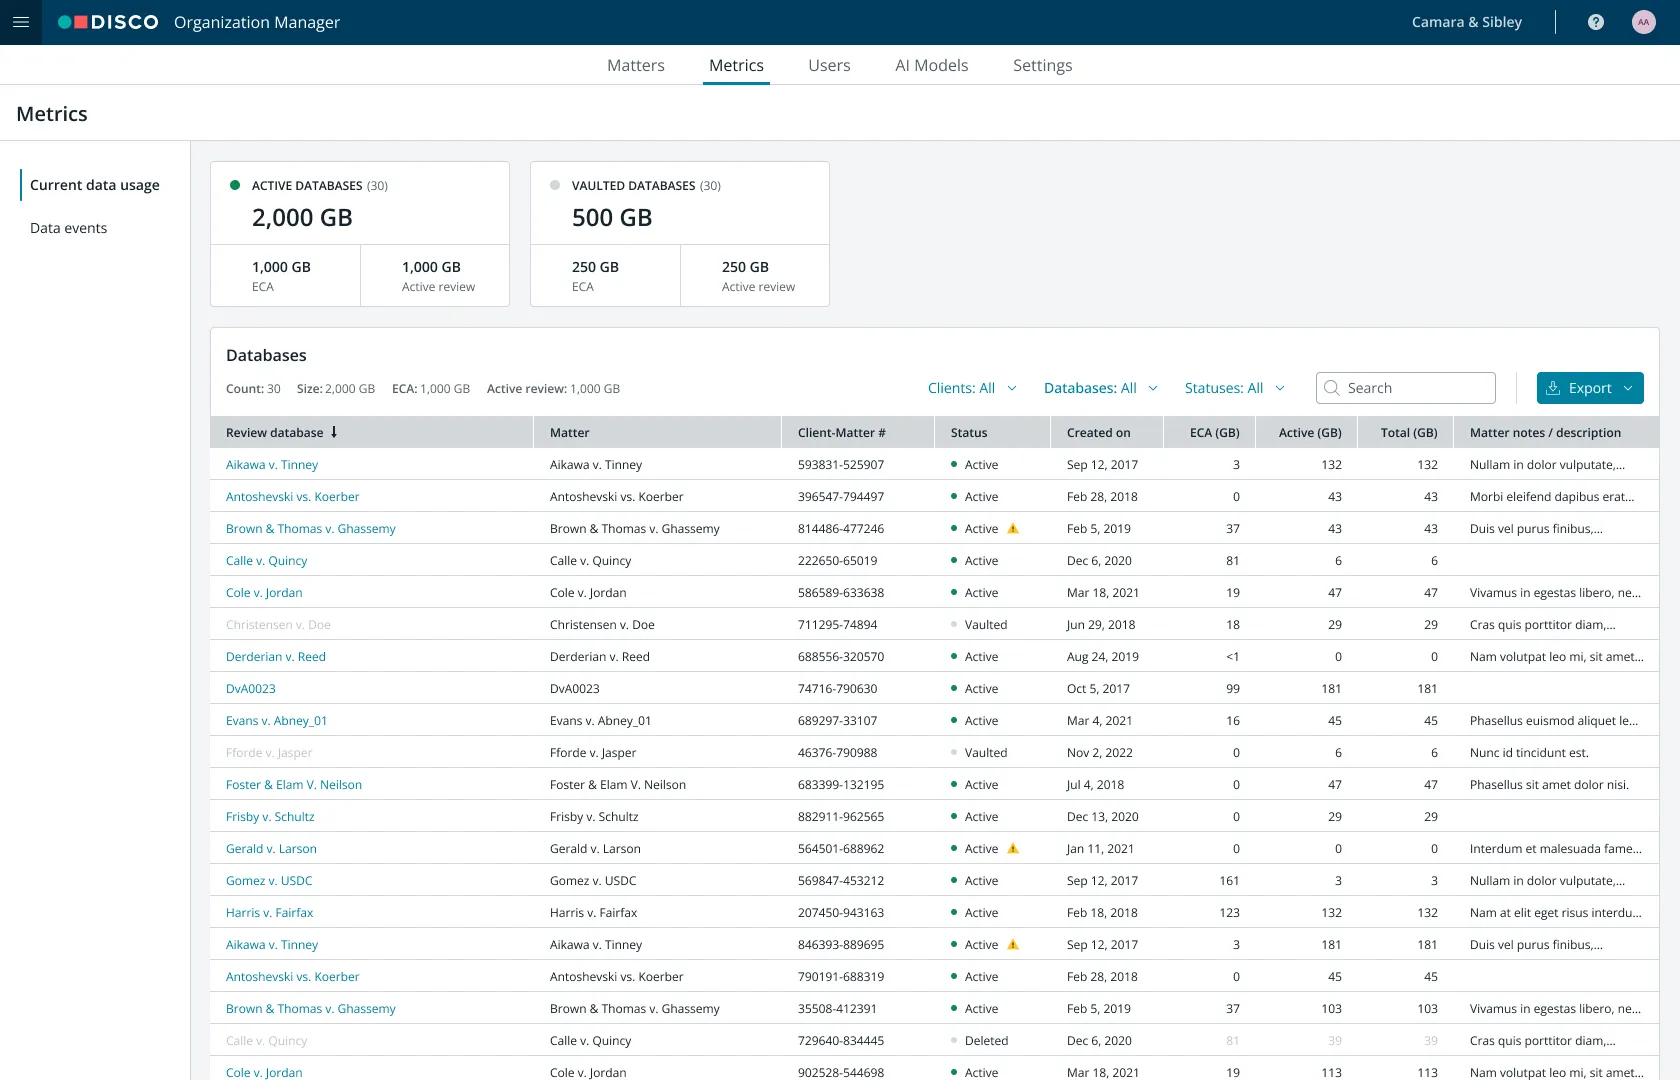
Organization Metrics in DISCO: a dashboard of usage over time with a filterable table below it. Global Relay
Sep 2021 – Dec 2021
Front-end engineer, UI library
Vancouver, BC (remote)
globalrelay.com ↗- Component library
- Legacy refactoring
A short contract on the component library of a compliance platform.
It came between two longer roles. I extended the component library of a large compliance and archiving platform and moved legacy screens onto it, so that the product looked and behaved the same everywhere and the team had one set of components to maintain.
Calabrio
Oct 2017 – Sep 2021
Principal front-end developer, Data Explorer
Vancouver, BC (remote)
calabrio.com ↗- React 16
- Victory
- react-virtualized
- styled-components
- ImmutableJS
- Material UI
Data Explorer, a BI tool rebuilt in React, with a pivot table built from scratch.
Calabrio makes workforce-optimisation software for contact centres, and joining them fulfilled a long-held ambition to work for an American company. I was hired as the principal front-end developer to modernise Data Explorer, their BI tool: replace the Java and GWT codebase with a React front end and reach feature parity. I designed the architecture and chose the libraries, and as more developers joined I led the team for several months, setting coding standards, reviewing code and mentoring.
The hardest problem was the pivot table. Nothing off the shelf could be customised far enough, so I built it from scratch on react-virtualized. It ingests a tree of data and renders cells and their children on the fly while keeping the hierarchy intact, with search, filtering, drill-down and inline interactions on top, and it stays responsive with millions of data points. It pushed everything I knew about front-end performance.
- Customisable dashboards with many chart types, tables and reporting, built with React 16, Victory, react-virtualized, styled-components and ImmutableJS.
- A custom component library on Material UI and styled-components, used across the product.
- Code standards, library choices, code reviews and mentoring as the team grew.
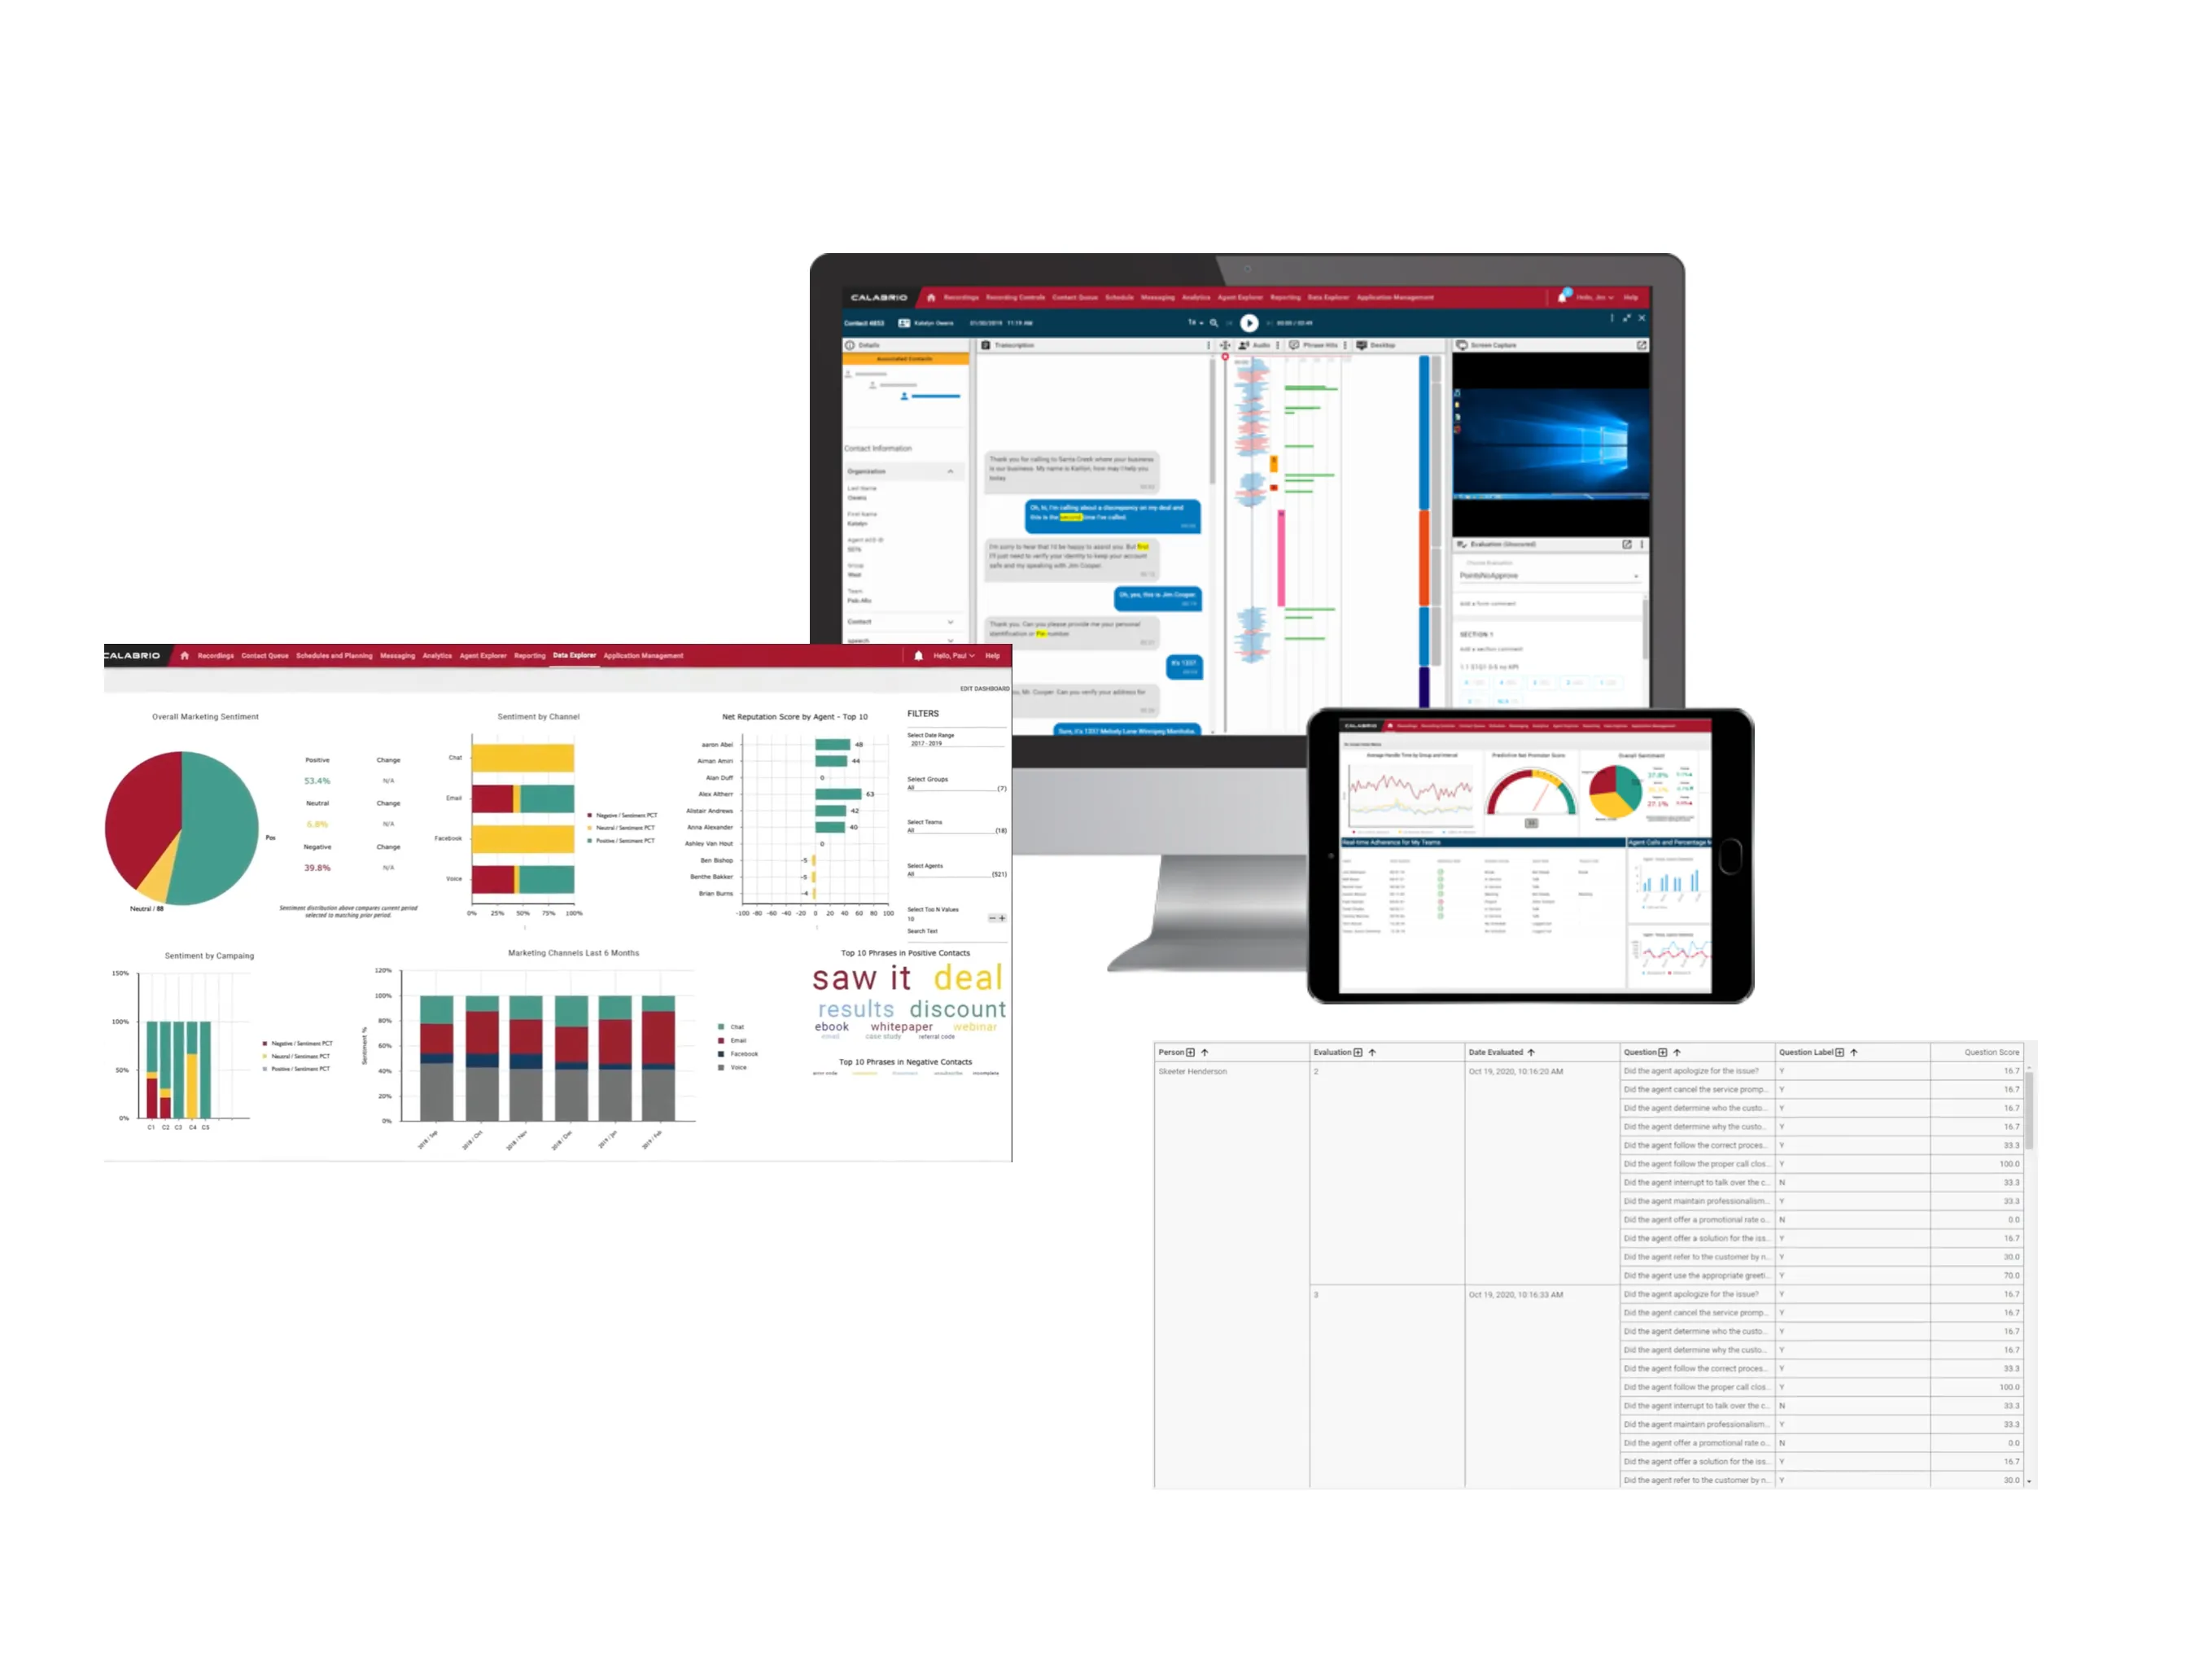
Data Explorer in Calabrio: a configurable analytics dashboard with charts and a pivot table. Cumul8
Jan 2016 – Nov 2017
Front-end engineer
Vancouver, BC
- React 15
- React Native
- Victory
- ImmutableJS
- react-virtualized
Real-time dashboards for a data analytics and IoT platform.
Cumul8 was a data analytics and IoT platform that helped companies monitor, analyse and act on their data. This is where front-end development clicked for me. I worked alongside people who shared what they knew freely, grew faster than anywhere before or since, and built my first real-time dashboards and interactive charts.
- The platform front end in React 15, Victory, ImmutableJS and react-virtualized.
- A library of reusable React components that kept the product consistent and the team quick.
- A React Native app that brought key features and an alert system to mobile.
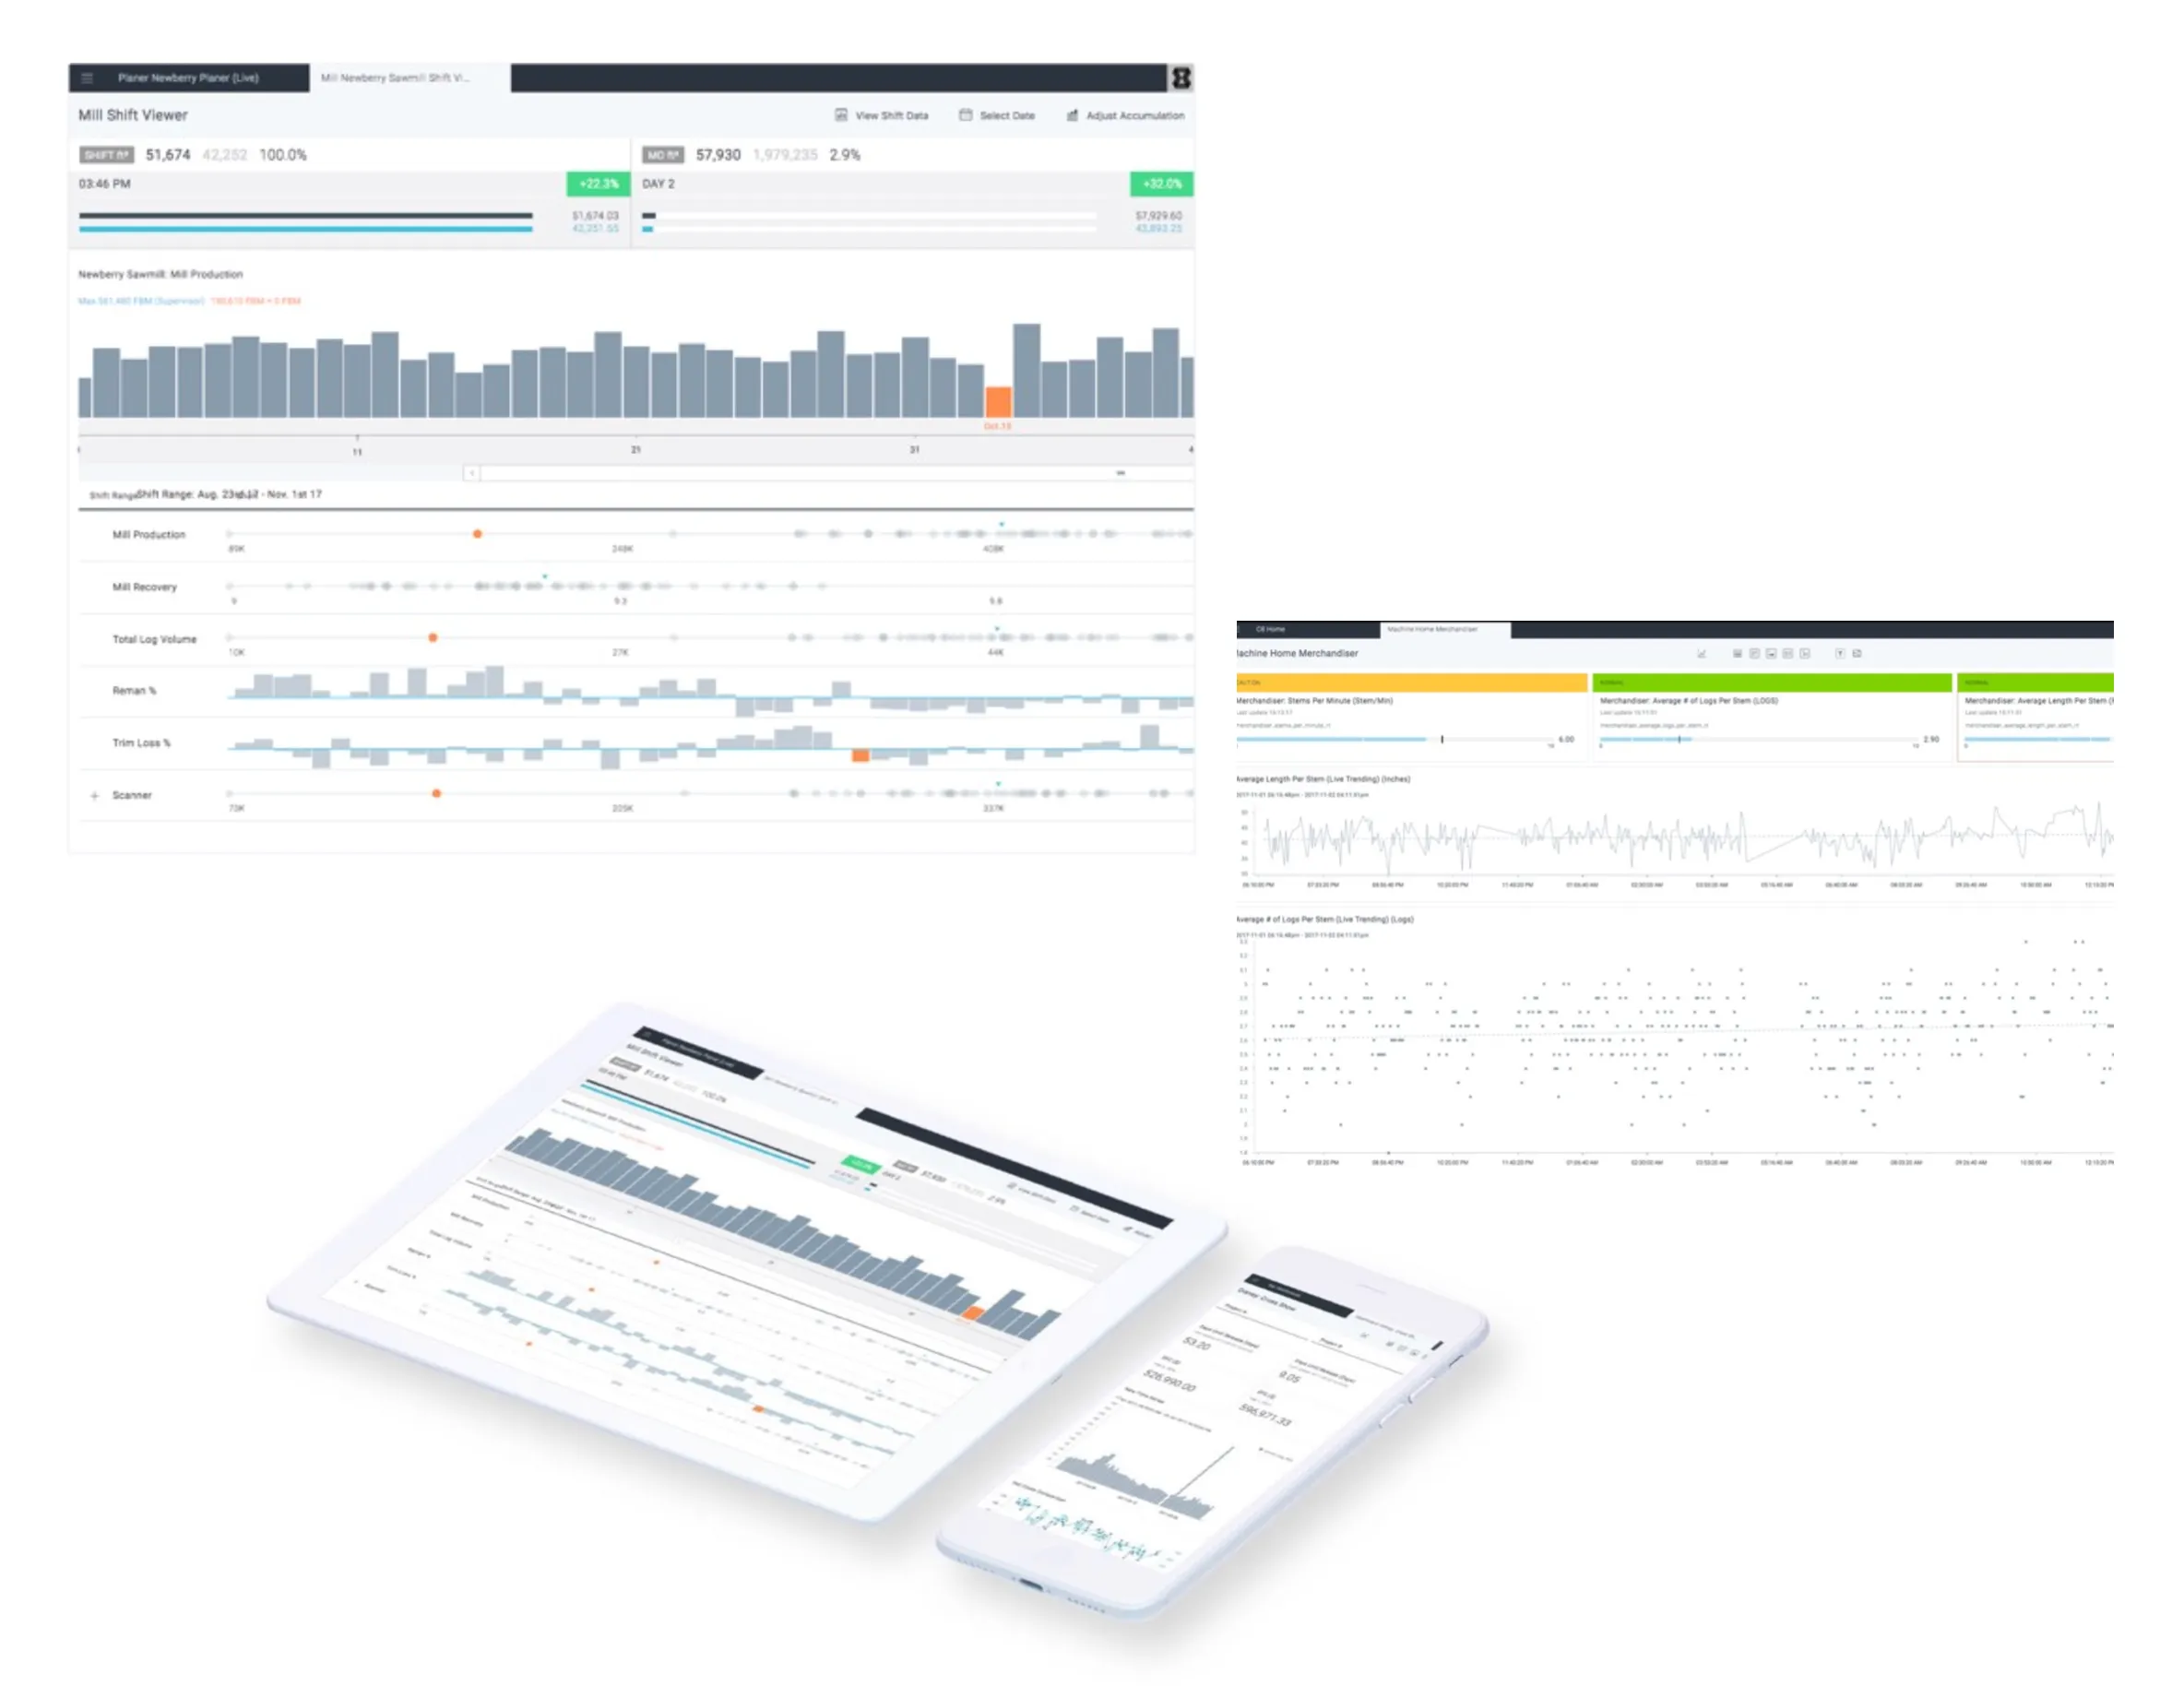
Cumul8: an analytics dashboard with live charts and gauges. Mobile-first marketing sites in React for film releases.
My first job in Canada, for releases among them The Gift and Secret in Their Eyes. Short deadlines, a lot of motion, and an education in making things work on every phone.
A data management application for ocean-observation programmes.
Where it started, at the end of my master’s, for the international programmes coordinated by JCOMMOPS, now OceanOPS. A desktop-like interface with custom widgets, dashboards and charts, and a map widget for exploring and downloading geospatial data. My first dashboards, and the first time I saw how much a clear interface changes what people can do with their data.
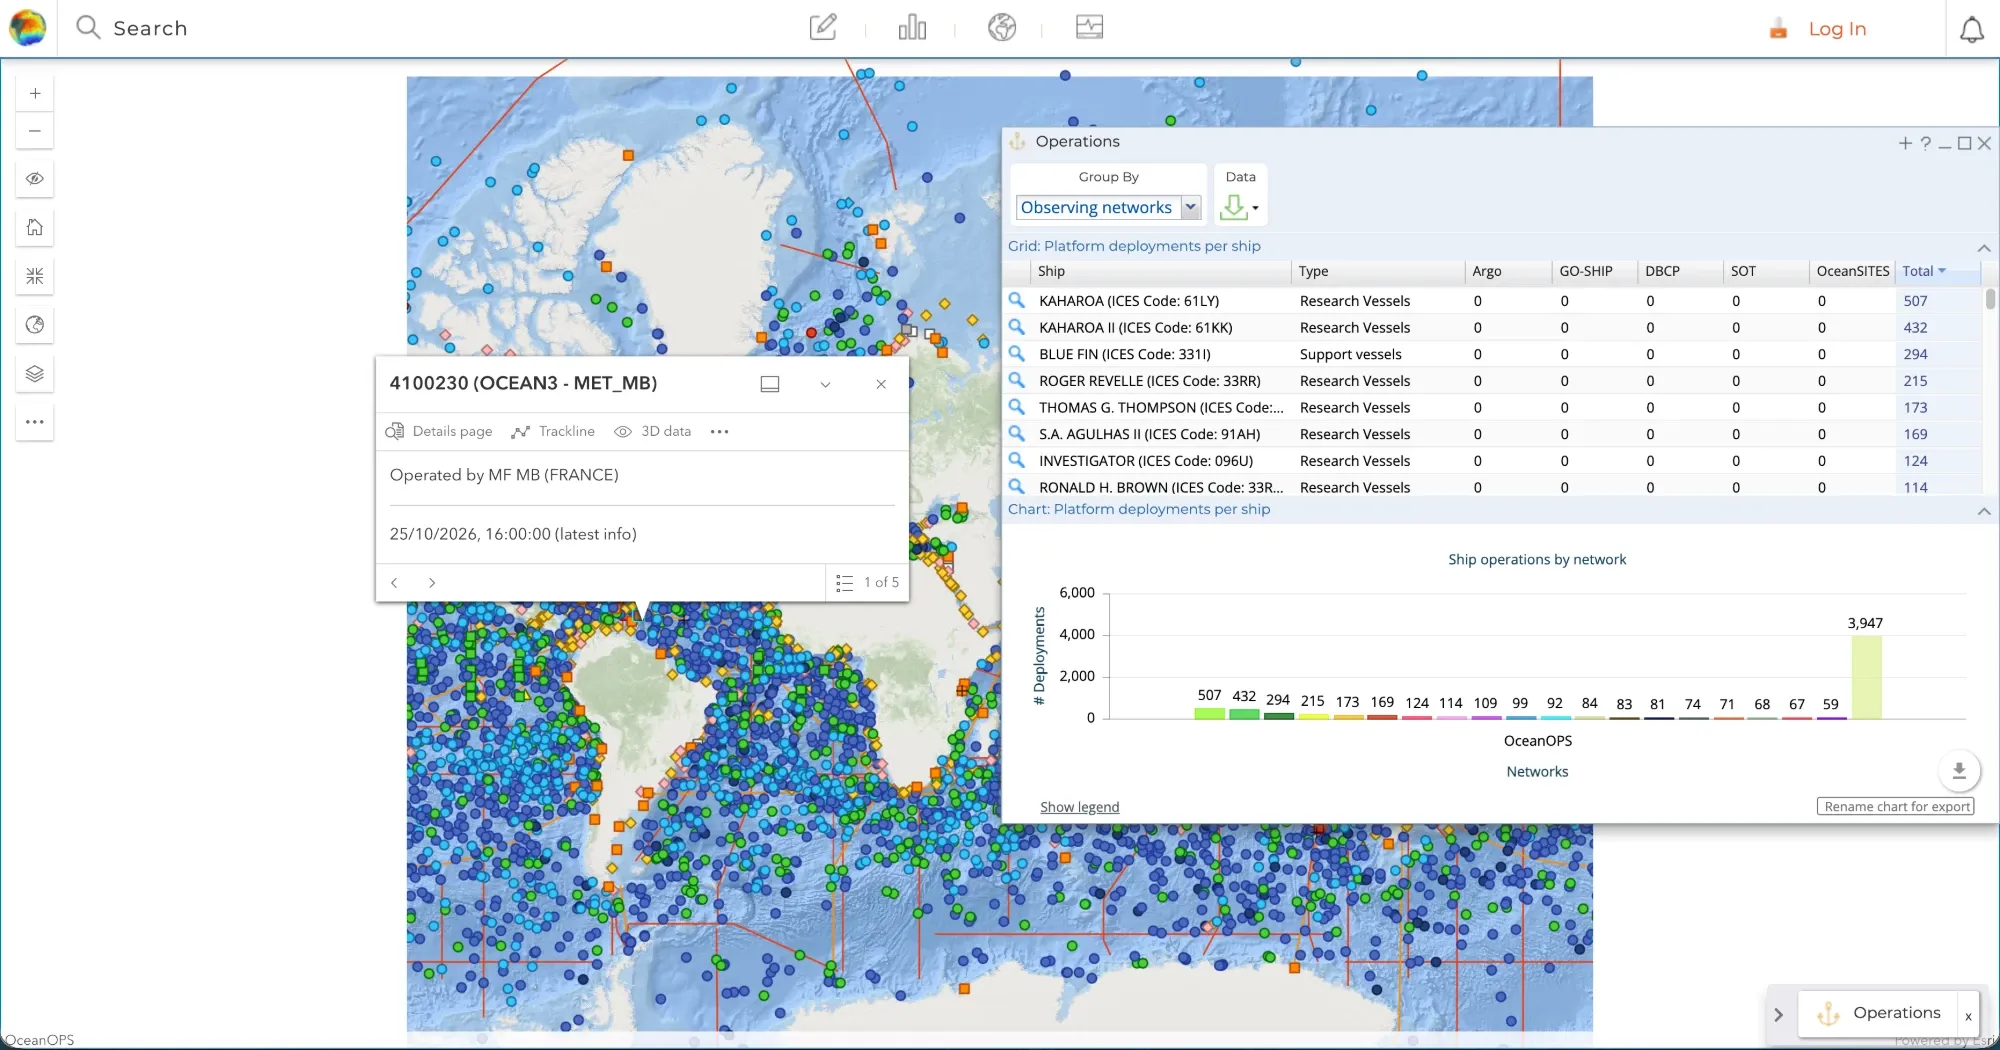
OceanOPS today: the map of ocean-observation platforms.
End to end
From the first spec to the last alert.
I do not stop at the front end. I own the whole path a feature takes: what gets built, how it ships, where it runs and how I know it still works.
01
Spec
Use cases and user stories written down before any code, so the scope means the same thing to everyone, agents included.
- Use cases
- User stories
- Written scope
02
Plan
The work cut into small pieces on a board anyone can read, with something to try every week or two.
- Agile
- Kanban
03
Build
Tests first where it counts and a review on every change, so a feature arrives with the proof that it works.
- TDD
- Automated tests
- Code review
04
Release
Every change built, tested and deployed by the pipeline rather than by hand. Small releases, and a rollback that is one step away.
- CI/CD pipelines
- GitHub Actions
05
Host
The same containers on my laptop and in production, whether that is a managed cloud or a server I run myself.
- Docker
- Docker Compose
- Managed cloud services
06
Monitor
Errors reported before anyone has to, health checks that message me, and what they show feeds the next spec.
- Error tracking
- Logs
- Uptime checks
On my own time
Projects that started as an itch.
Second brain
Ongoing
- Obsidian
- Self-hosted LiveSync
- CouchDB
- Git
- restic + Backblaze B2
- Ubuntu server
- Docker
- Tailscale
- Hermes agent
- Claude Code
- Telegram
- Homepage
My notes, my agents and my apps, on a server I own, encrypted wherever they travel.
Everything I learn and plan lives in one Obsidian vault of plain Markdown, and it left iCloud for hardware I own. Self-hosted LiveSync encrypts each note on my MacBook or iPhone before it syncs, near instantly, through a CouchDB on the server, and a headless client there writes the vault out as plain files. Those get a Git commit every 15 minutes, and the history is in a nightly restic backup to Backblaze B2, encrypted before upload and restore-tested. The rule: my notes only leave the house end-to-end encrypted.
The server is a headless Ubuntu box under my desk with no port open to the internet: everything reaches it over Tailscale. Hermes, an open-source agent, runs on it around the clock and I message it on Telegram; Claude Code reaches the same files over SSH. Both read and write the vault under house rules in an AGENTS.md, and Hermes keeps the server running from a setup guide that is itself a note in the vault. A dashboard shows every service, its health, what the models cost and the last backup.
ScrollUp
Ongoing
- React
- Vite
- TypeScript
- Fastify
- PostgreSQL
- Drizzle
- Markdown vault
- Claude Code agent
- Marker
- Crawl4AI
- yt-dlp + Whisper
A quarter of an hour a day of machine learning, taught from my own sources.
The problem: I wanted to close a specific skill gap, the fundamentals of machine learning on top of my software engineering, and no course or feed fit. So I built the dashboard I open every morning: two tabs, Learn and Practice, with streaks, XP and levels so that coming back is satisfying.
It has no fixed subjects. What it teaches comes from the sources I give it: book chapters through Marker, newsletters through Crawl4AI, videos through yt-dlp and Whisper, into a Markdown vault that is also my notes. An agent turns those raw sources into lessons and exercises, every item cites its page or URL, and the app indexes and serves the vault.
My Personal Journal ↗
2024 – ongoing
- TypeScript
- React
- styled-components
- Firebase
- Cloud Functions
- Playwright
- GitHub Actions
A private online journal, encrypted end to end.
Every entry is encrypted on your device before it is saved, so nobody else can read it, not even the server. Rich text, photos encrypted the same way, tags, links between entries, search, and a book you bind in the cover and font you like.
It started in the summer of 2024 out of a long habit of writing things down, and it has been built the same way since the first commit: specs in Markdown, tests first, every change through a pipeline.
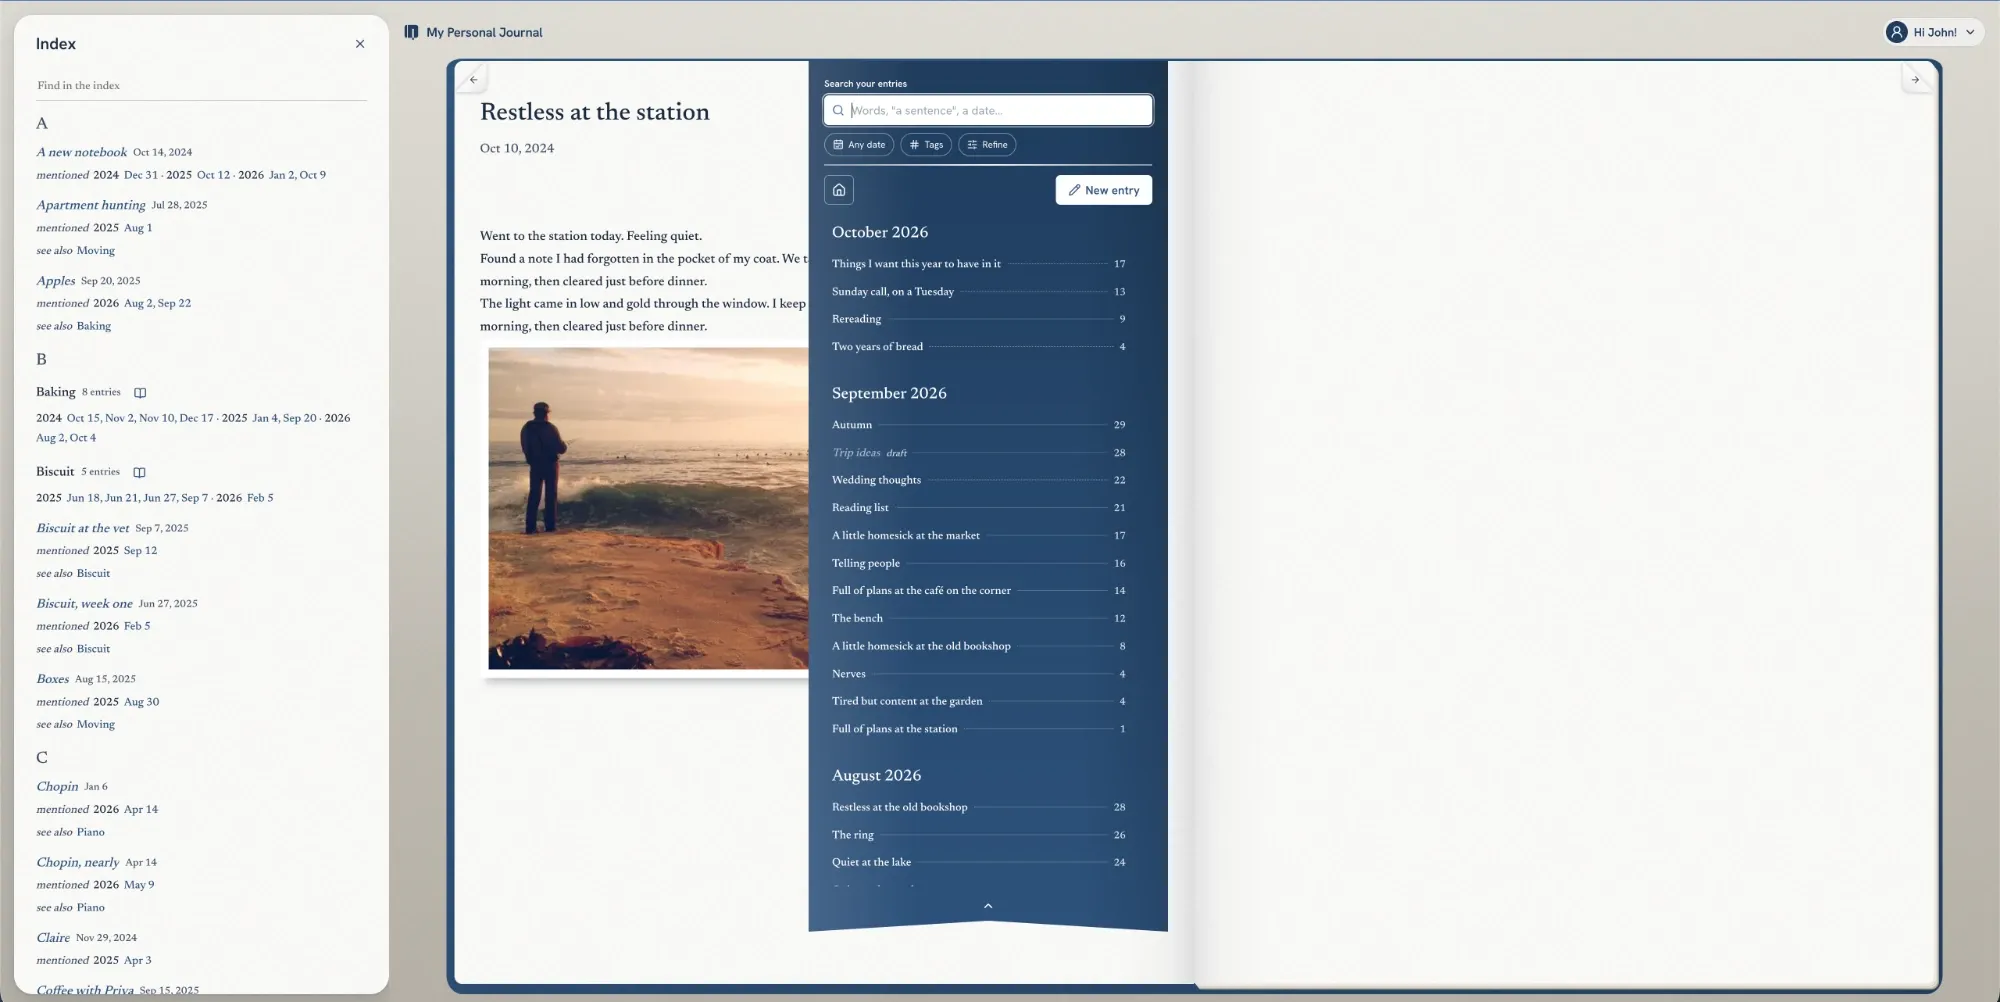
My Personal Journal: an entry open in the book, beside the index of linked entries. Trade Seeds
2019 – 2021
- React
- Python (Flask)
- MongoDB
- REST API
- Self-hosted
A trading plan I wrote every morning and checked every evening.
During two years of day trading I needed discipline more than data. Each morning I picked a handful of stocks and planned the trades; each evening I compared the plan to what I had done. The name comes from the idea that a planned trade is a seed: it only grows if you leave it alone. It kept me honest, and it taught me more about my own decisions than any chart.
Contact
Curious about any of this?
Happy to go into the details of any of it, or to compare notes if you have solved the same problems differently.
Read my resume